
VS Code debugging for web developer
A comprehensive guide into debugging web applications inside VS Code

Debugging in VS Code for web developers.
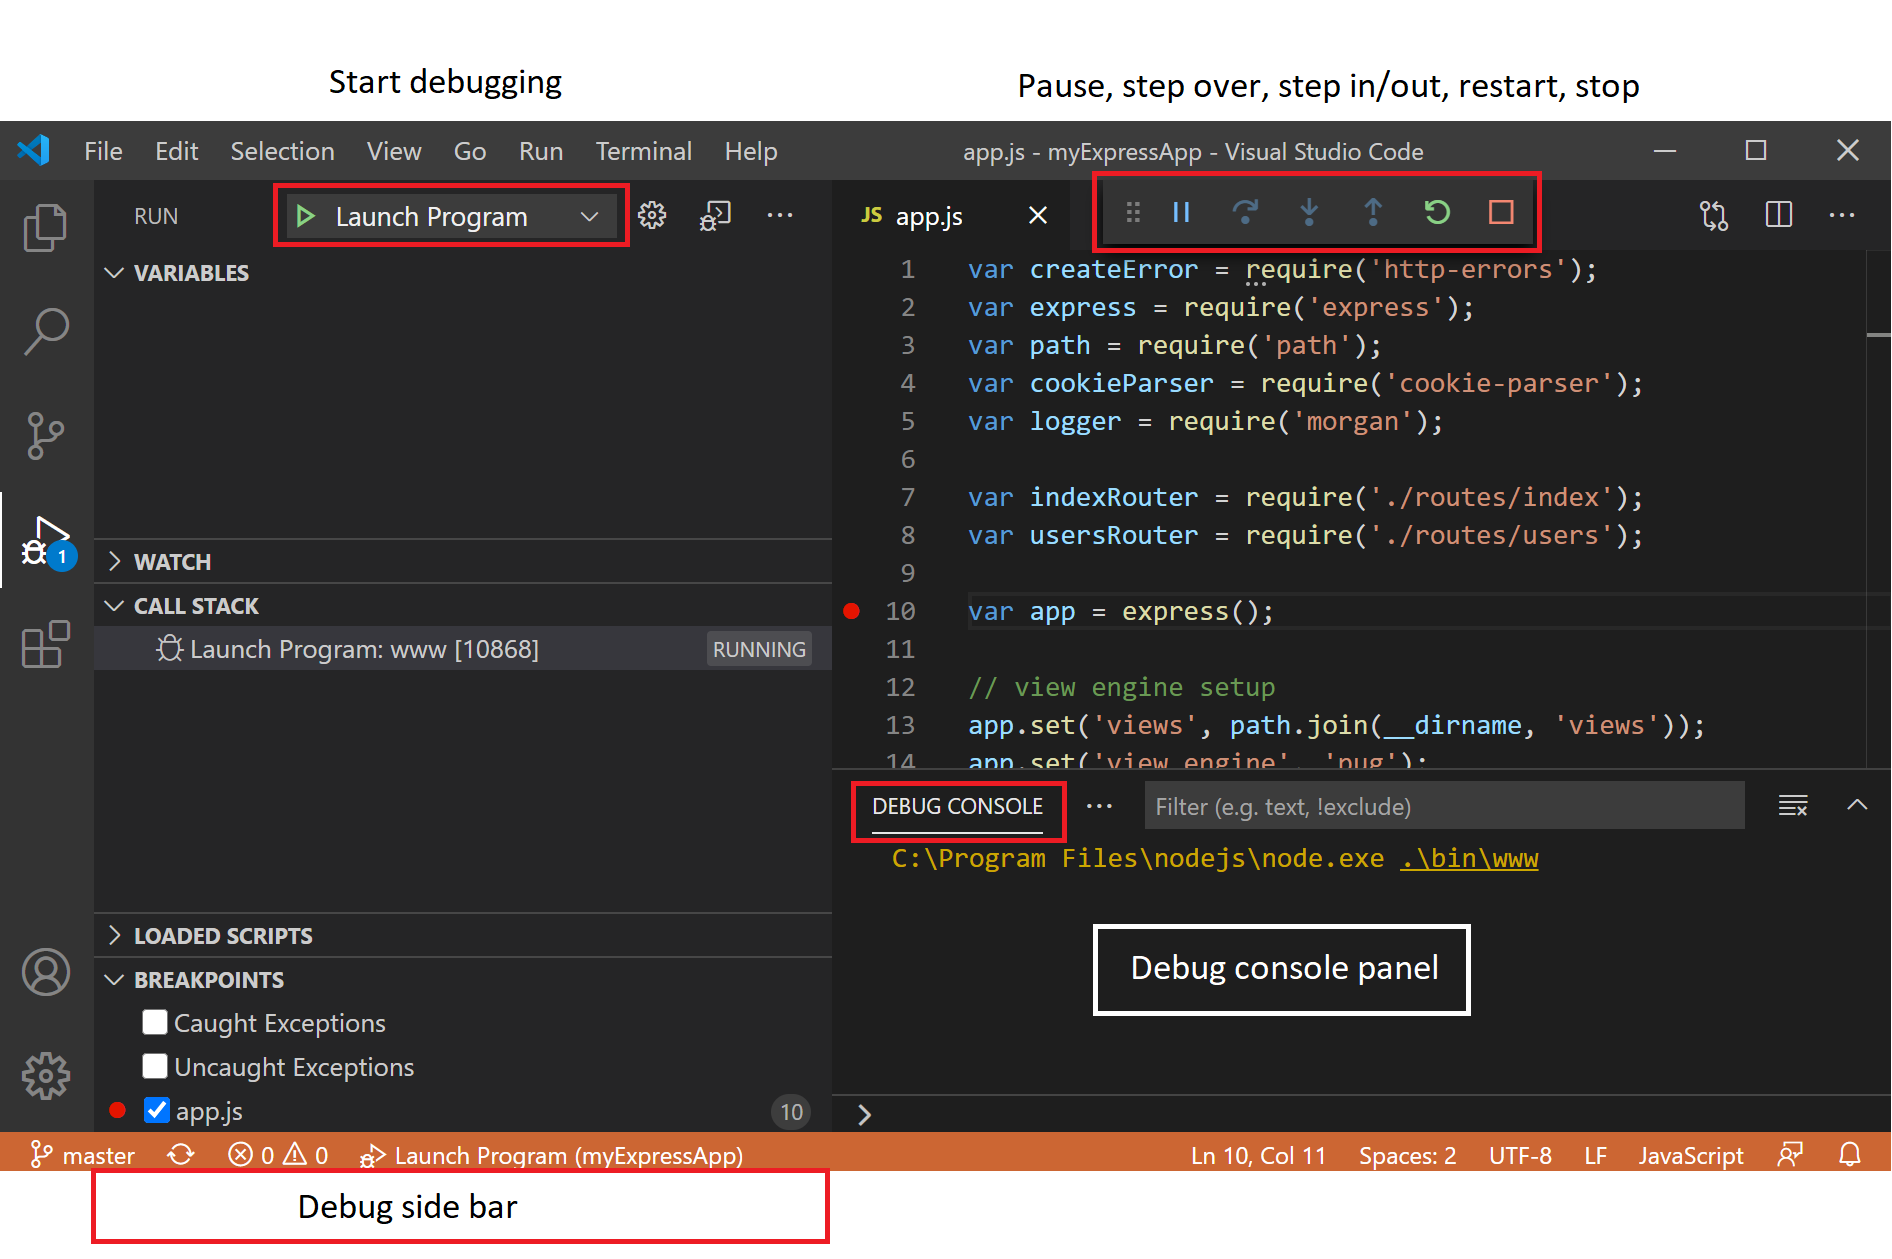
What is VS Code.
Visual Studio Code is a light weight IDE for developing and debugging web applications or projects that run on javascript.Although by installing extensions you can extend the functionality to support different languages within the IDE. Vs Code is built on electronJs which is a JavaScript framework for building native desktop applications,Which means it comes with full support of running JavaScript applications for web developers.
Electron JS has main process and render process.Main process runs nodeJs in back-end whereas renderer process runs any web application using any web framework in JavaScript.
Intelligence and presets for web development
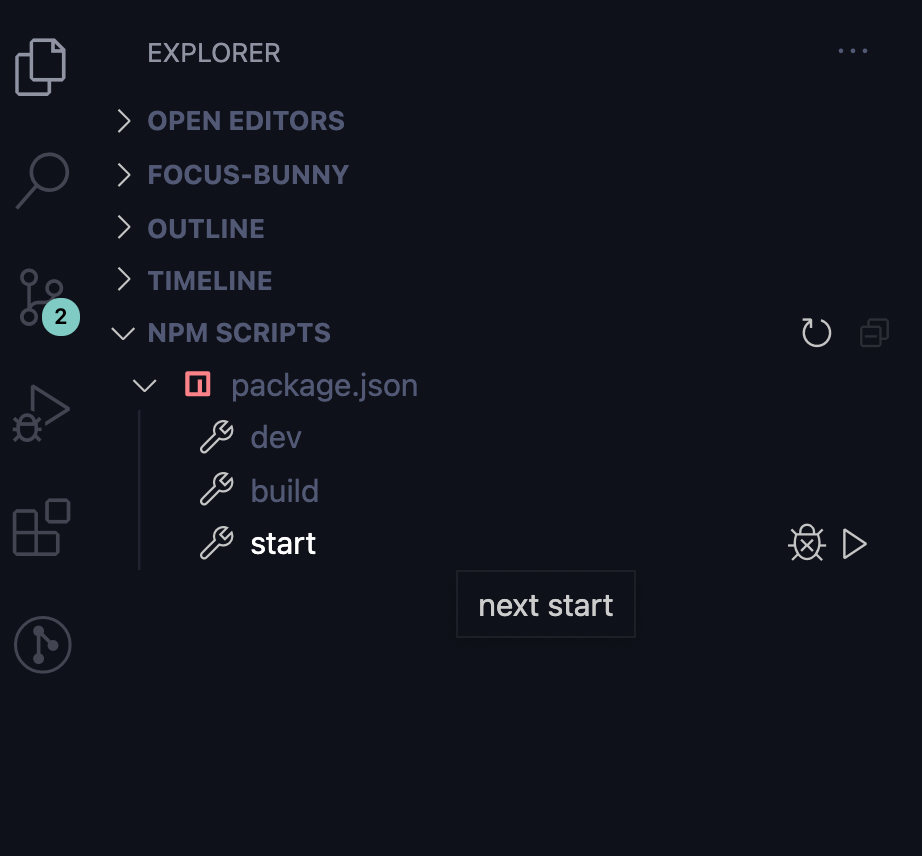
- Suggests all the node commands to run directly from package.json file
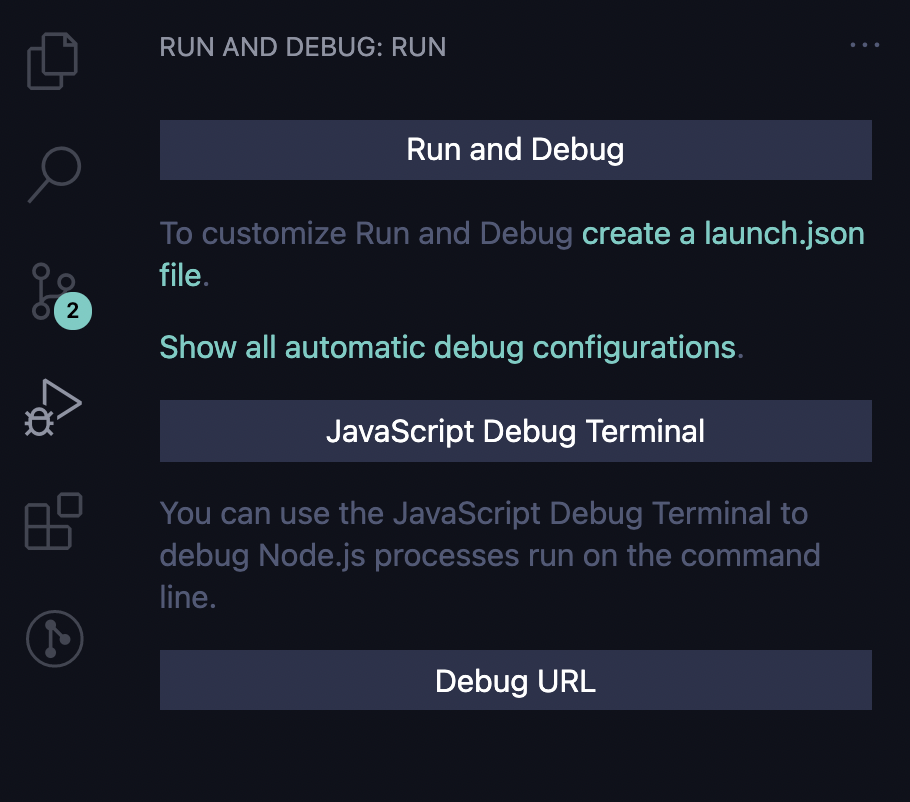
- The Debug tab on the left toolbar helps you to switch to debug mode instantly
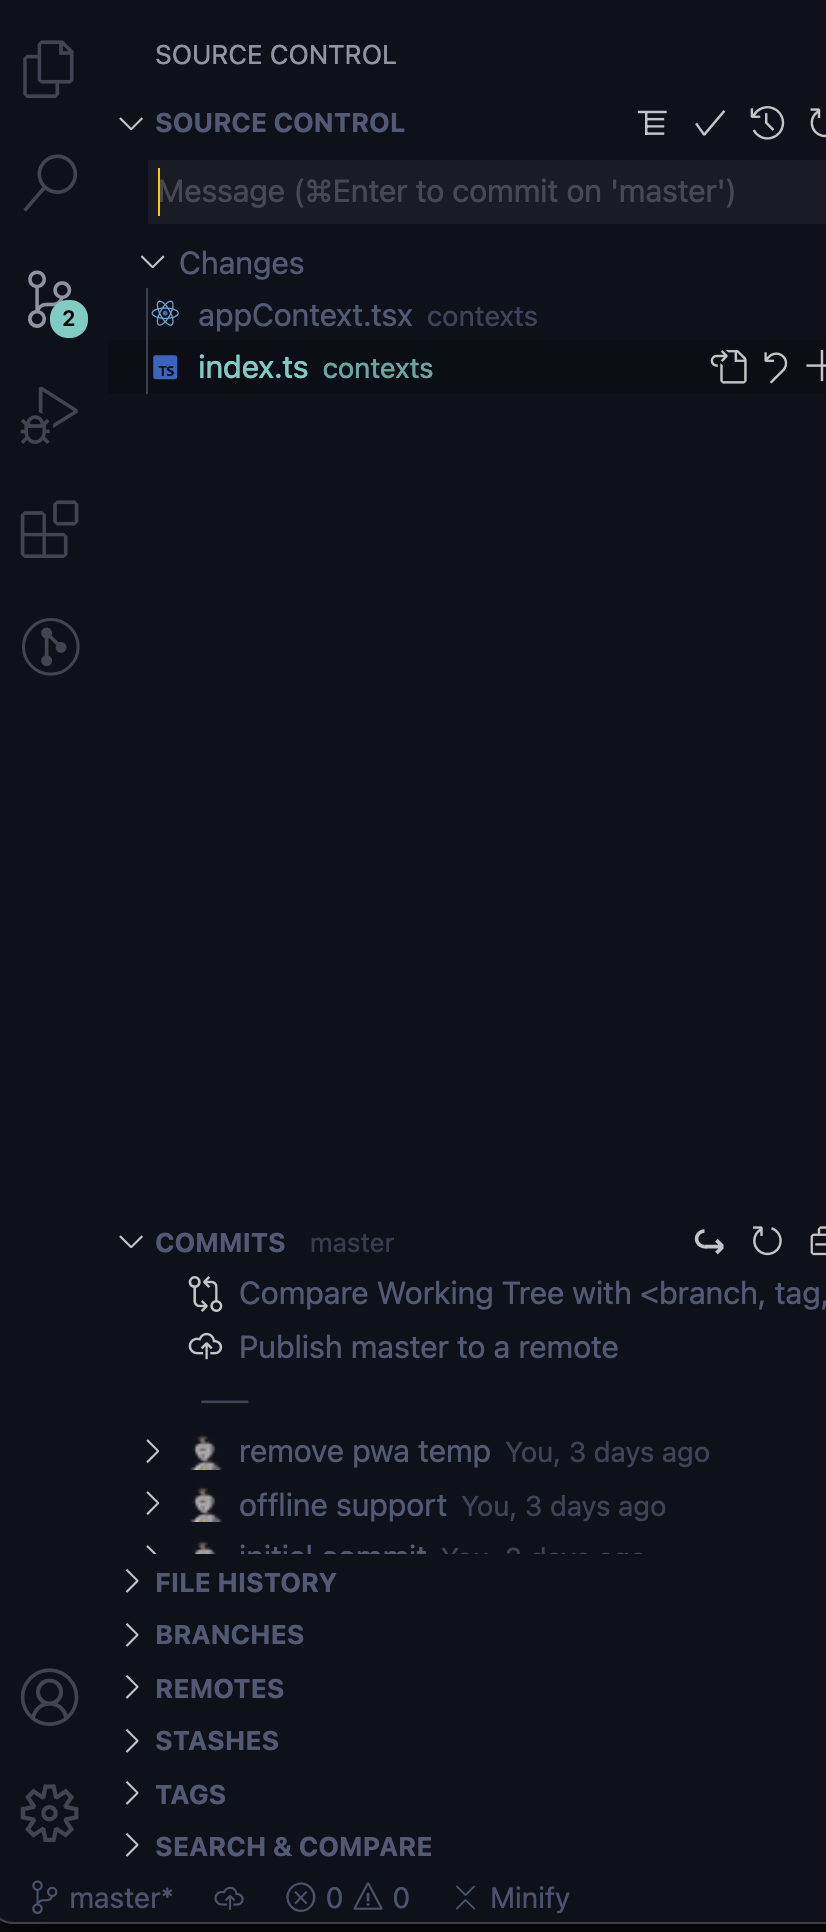
- Full support for GIT out of the box
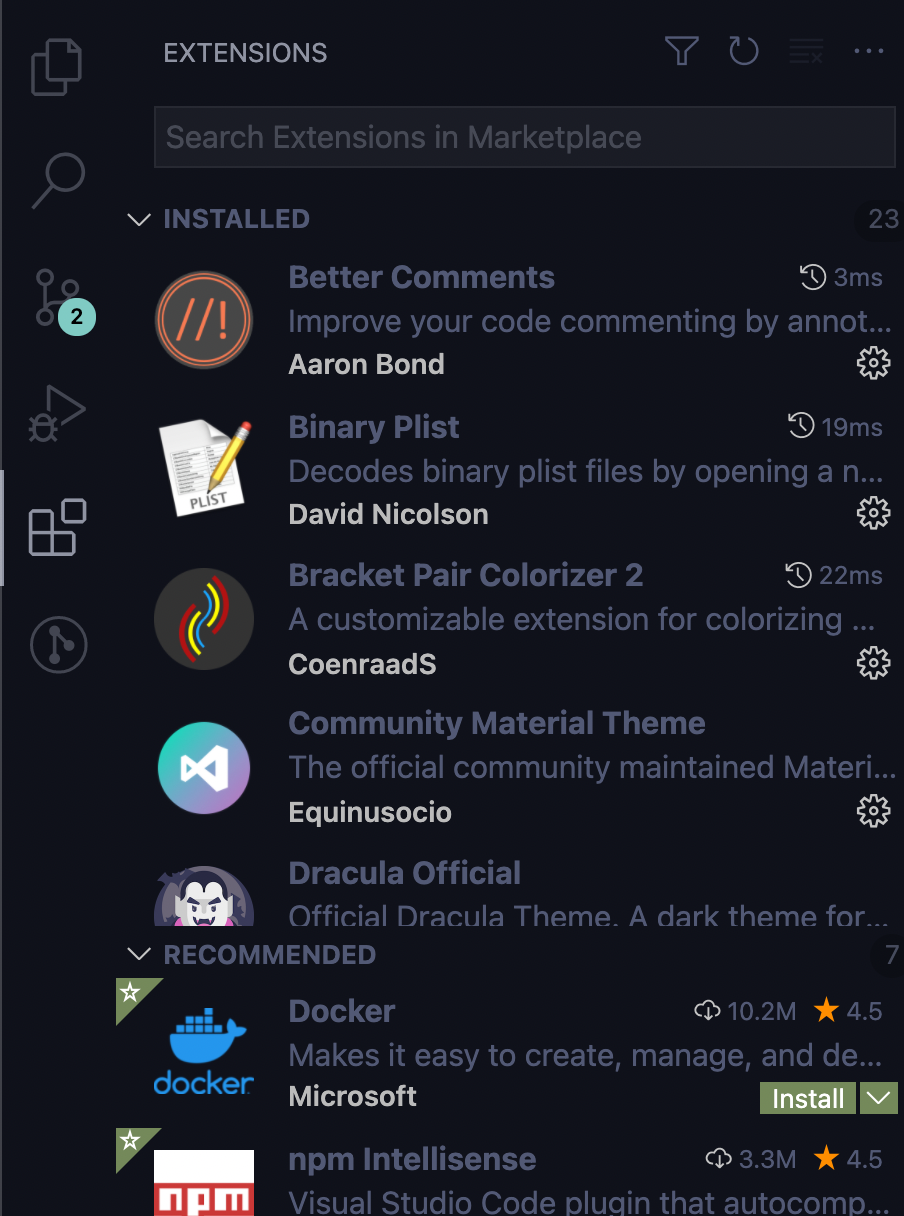
- Extensions to give more features for the existing IDE which is fully Customisable
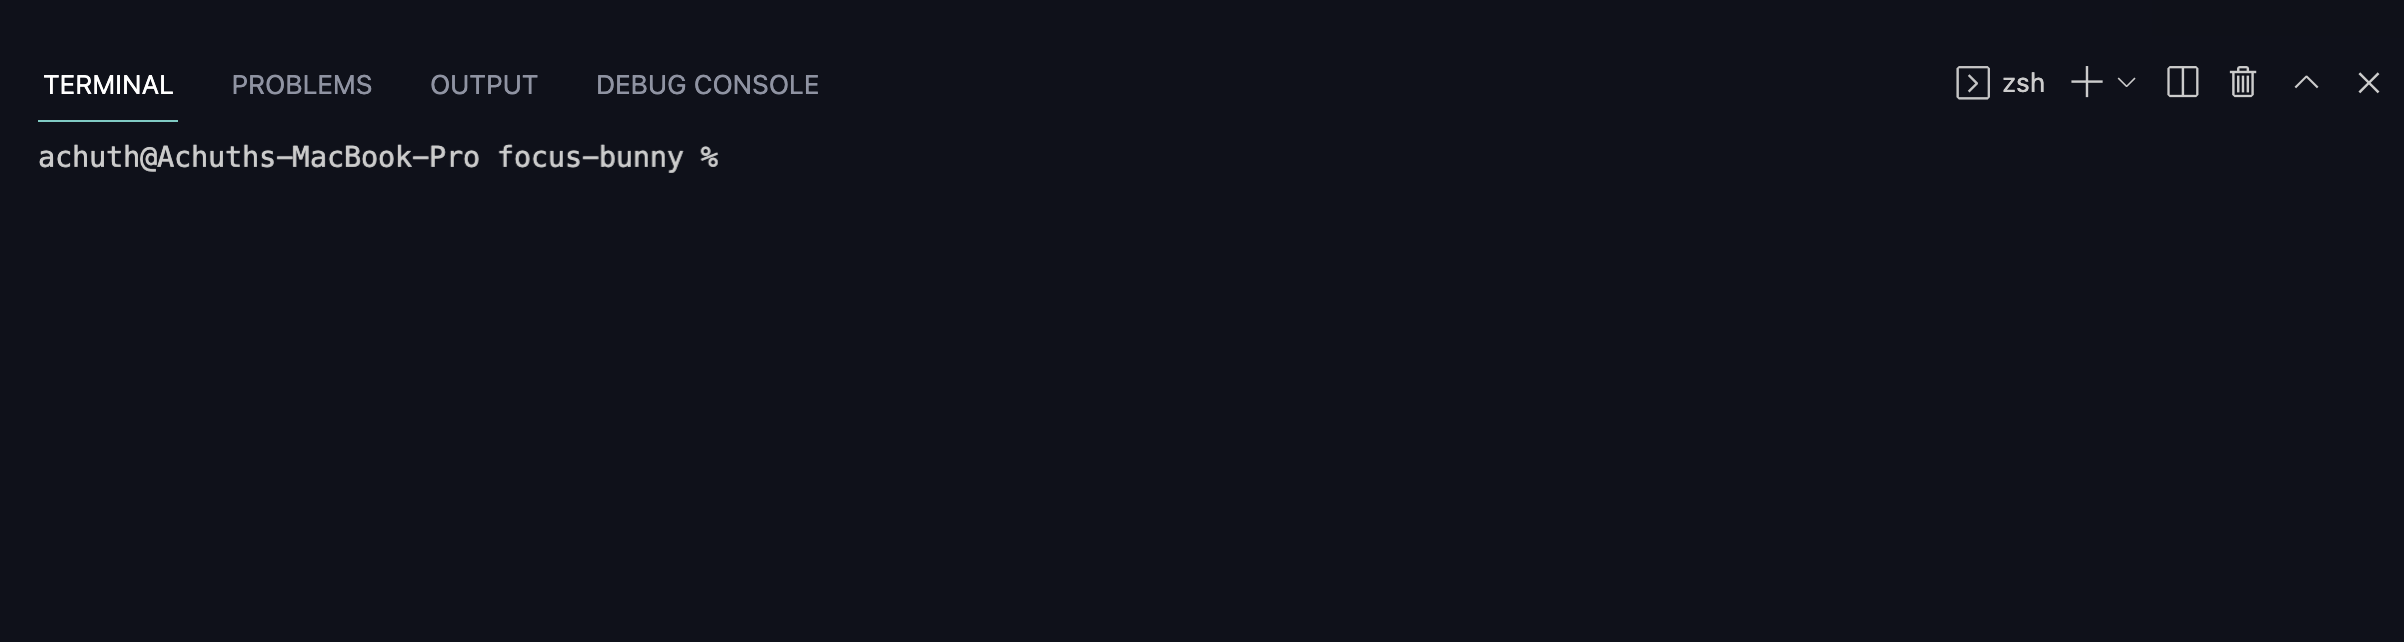
- Integrated terminal with multiple instances
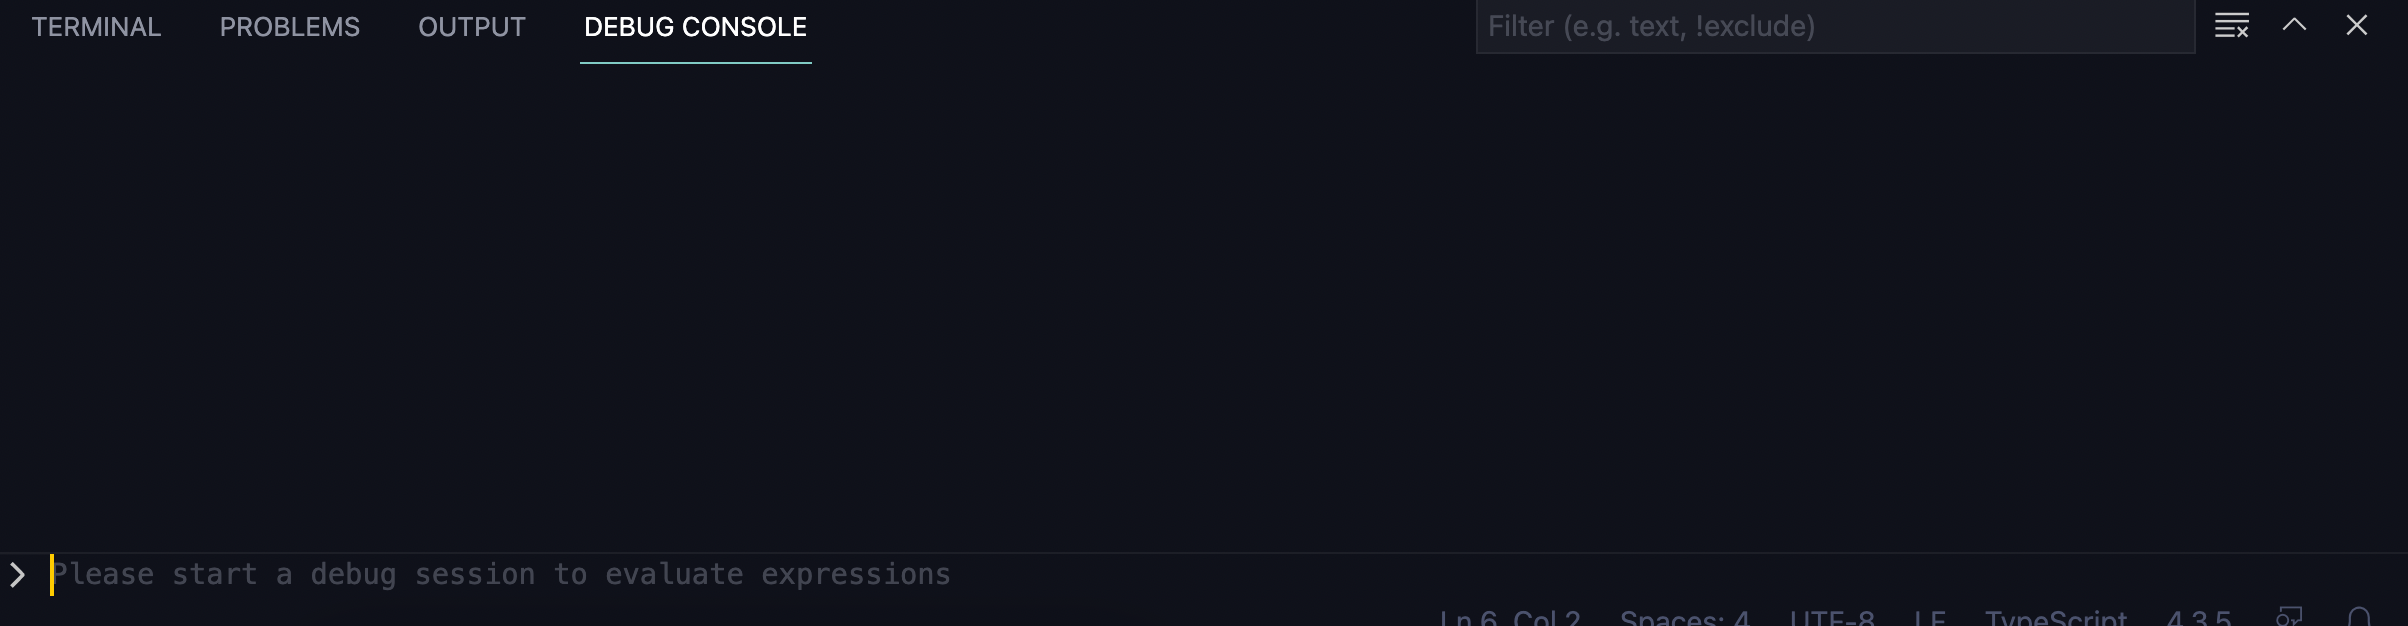
- Debug console to enable browser level js execution during debugging
- Simple browser like view so you don’t have to learn again
- put a debugger inline in the Editor.
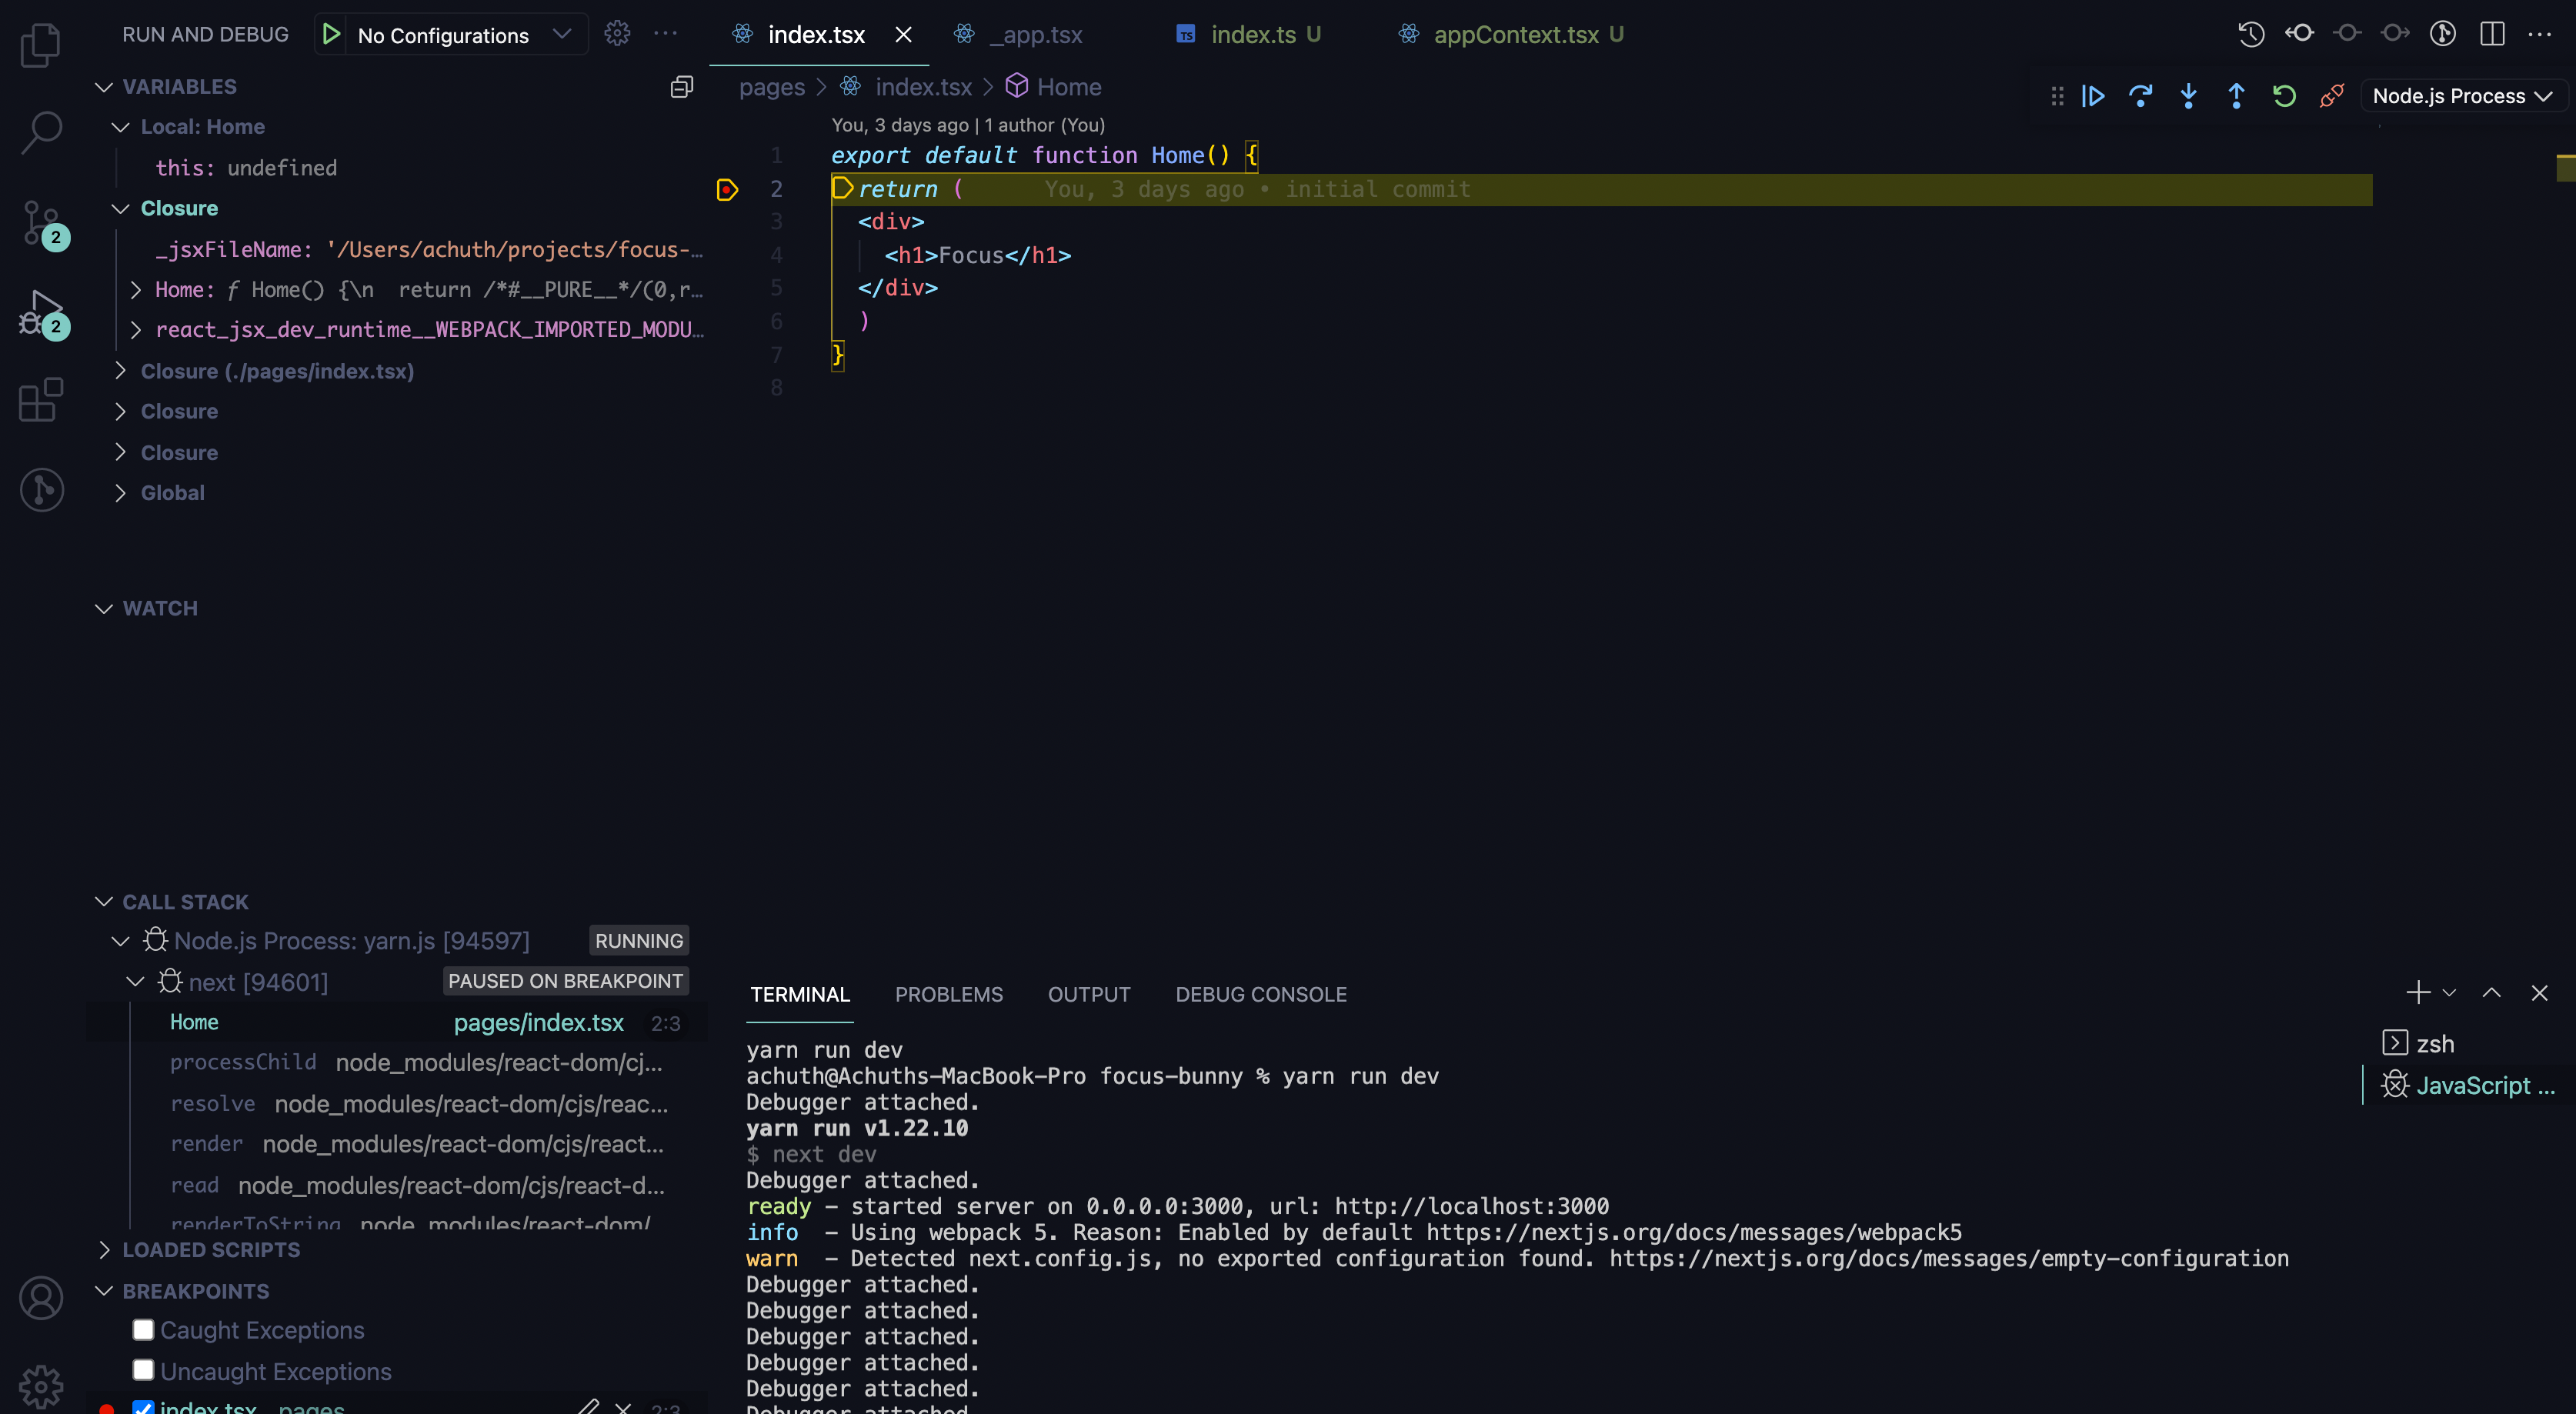
- simple controls to navigate through the debugging process

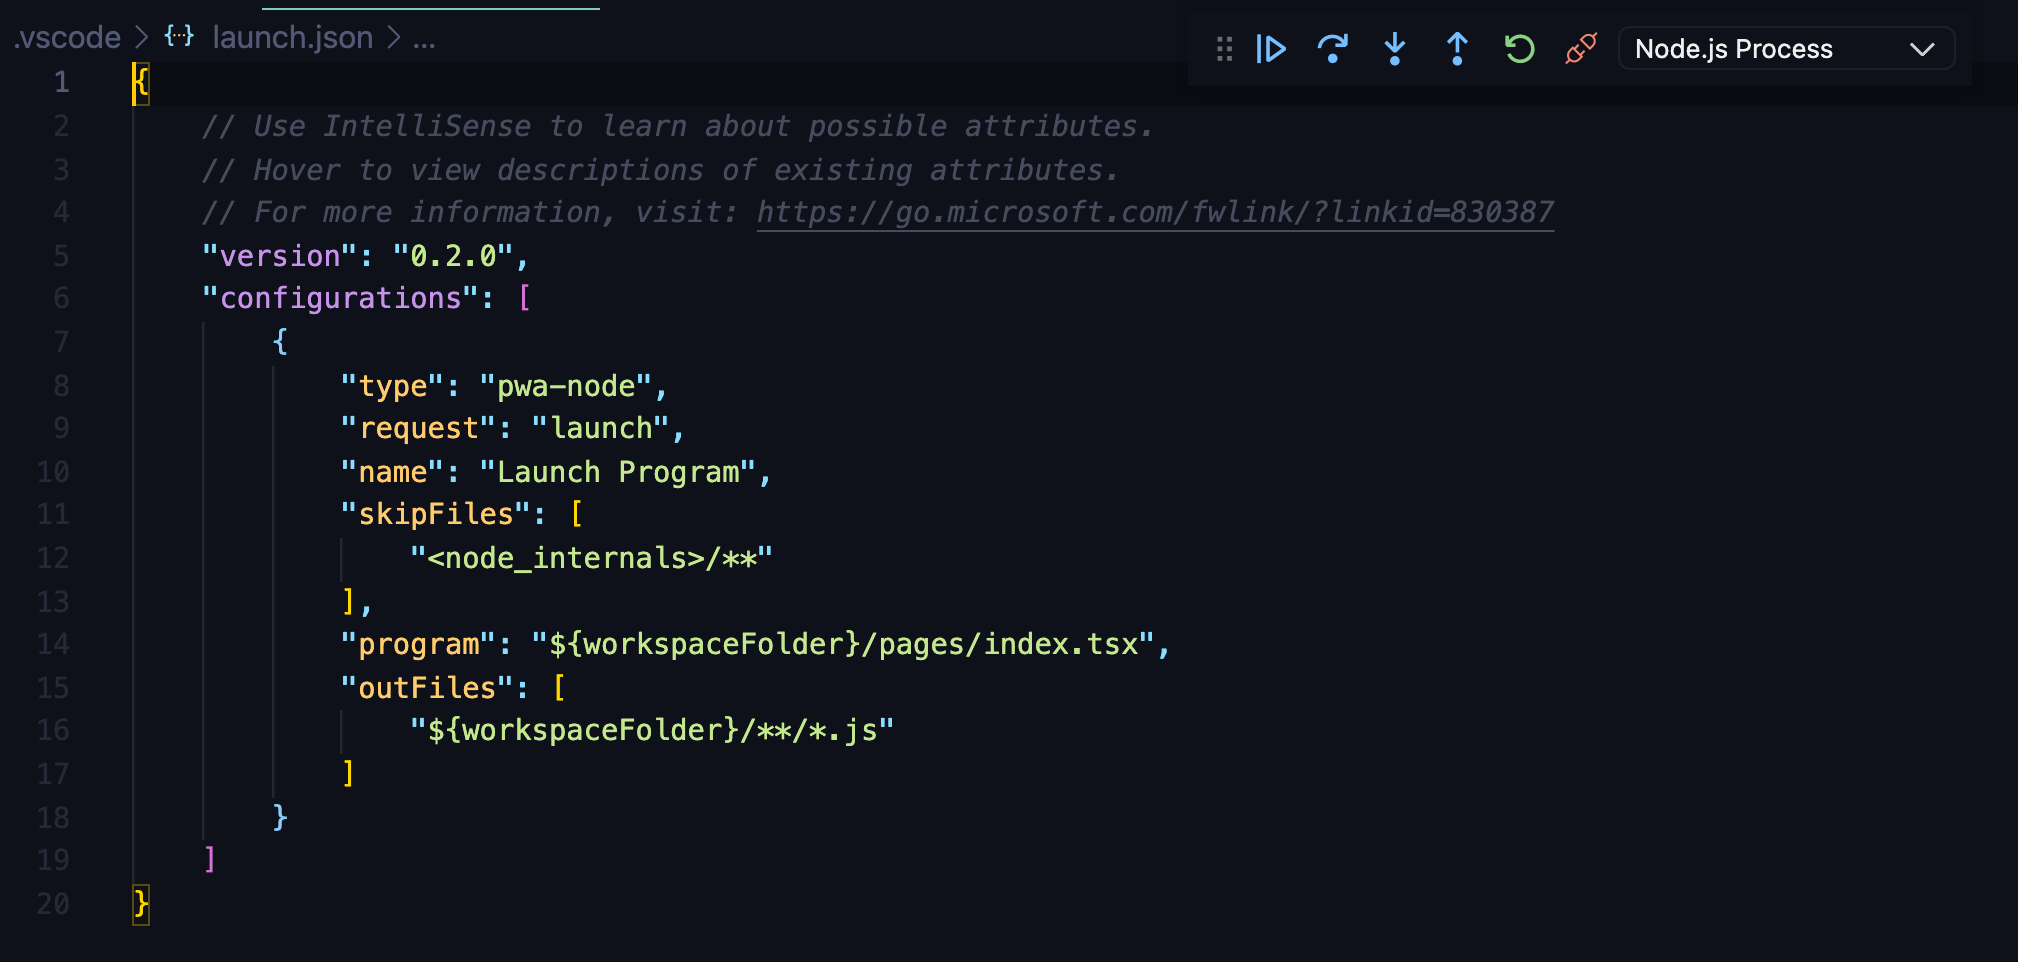
- create your own environment by creating
.vscode/launch.jsonfile and maintaining the suggestion
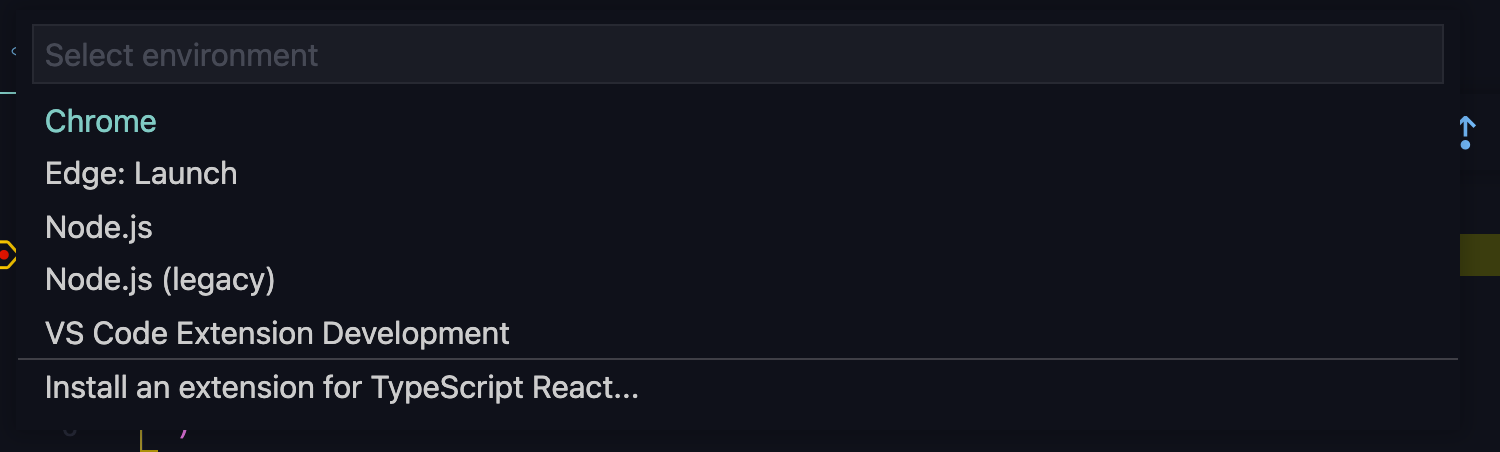
- Below is a sample nodejs configuration
Conclusion
Thanks, hope this helps you get basic idea for debugging web applications in VS Code . Read more here
